For the last couple of years, all eyes have been on LG Display (LGD) in hopes of them producing a competitive OLED supply chain that could rein in Samsung Display’s monopoly over the mobile OLED market. We first received wind of this potential upbringing early-2017 when Google offered to invest nearly $1 billion USD into LG Display in hopes to secure a stable supply of flexible OLED for what would be the Pixel 2 XL. A few months later, the whole ordeal seemed to become an order of magnitude more serious when Apple hopped on board and reportedly invested $2.7 billion USD into the South Korean display maker in exchange for putting up a new OLED manufacturing line exclusively for Apple. Fall came around and we got to see an early preview of what was to come with LG Display’s first mobile OLED on a consumer smartphone on the LG V30 and the Pixel 2 XL. Early receptions to the panels were overwhelmingly negative (which I have previously covered in depth), tipping many to believe that LGD was not the OLED savior we were hoping for, and even angering many consumers to the point where they would bash OEMs for even considering sourcing their displays from LGD.
Half a year later, LG Display signed on as Apple’s second OLED supplier, and soon after, passed a series of Apple’s stringent quality tests. Thus, LG Display re-piqued our attention, and we looked forward to the release of the LG V40 ThinQ and the Google Pixel 3 as both were rumored to use LGD’s next-generation mobile OLED. The Pixel 3’s display was confirmed to be sourced from LGD, and we have reviewed it to be an overall noticeable improvement over both the Pixel 2 (a Samsung display) and especially the Pixel 2 XL of last year. However, the Pixel 3’s LGD panel still had some of the issues we noted from the Pixel 2 XL, but to a lesser extent. While still a decent panel and a clear improvement, the Pixel 3’s display still wasn’t quite the Samsung-catcher we were hoping for.
It’s not quite the end of the road for this generation, however. We still have to take a good look at LG’s latest flagship, the LG V40 ThinQ.
Performance Summary
The LG V40 ThinQ sports a flexible OLED on the front that rounds off the bezels towards the sides. The rounding begins just at the edge of the visible screen, making it a difficult candidate for well-fitting screen protectors. The 3D front glass is also culprit to the handset’s hollow-feeling front, which was also observed with the Pixel 2 XL’s 3D glass.
The screen’s native resolution supports up to 3120×1440 pixels, but the display is set to 2340×1080 by default. At this resolution, it is noticeably less crisp than in its native resolution, especially when viewing text. At its native resolution, the screen’s pixels are unresolvable past 9.1 inches, which should appear plenty sharp for typical smartphone viewing distances (~12 inches) with 20/20 vision, with slight room to spare to accommodate those with higher visual acuity.
In display brightness, the LG V40 ThinQ’s display is comparable to the likes of Apple and Samsung displays in its Auto mode under high ambient light, measuring a maximum white level of 556 nits at 100% APL, 781 nits at 50% APL, and peaking at 914 nits when emitting a tiny white region of the screen at 1% APL.
Out of the box the LG V40 ThinQ targets a cool and punchy color profile that is about 25% more saturated than our standard RGB color space. In the Auto and Expert profiles, it is possible to modify the display’s overall color temperature (albeit in a flawed manner) and to modify the relative reds, greens, and/or blues. The handset offers 6 other color profiles, and do provide profiles that accommodate the P3, Adobe RGB, and the sRGB color spaces. However, all three of the reference color profiles have a greenish-white point, and only the Web profile (which targets the sRGB color space) competently matches its target (though as seen in our Pixel 3 display analysis, LGD’s panels are completely capable of having near-perfect color accuracy with more adept calibration). Furthermore, none of the color profiles support Android’s color management, introduced in Android 8.0 Oreo, and even if it did, it wouldn’t mean much since almost no Android apps support it.
Color tones are shaded adequately on average. Shadows may appear slightly lighter than standard, and mid-tones appear slightly too dark, with an average resulting gamma of 2.25 for the calibrated color profiles and about 2.3 for the wide non-standard profiles, including Auto.
In display power, we measured the LG V40 ThinQ display to emit with 25% more luminous intensity per watt than the LG display on the Pixel 3 at 100% APL, and 8% more at 50% APL. The power efficacy figures for the LG V40 display are higher than most other OLED displays, but it isn’t likely to make a significant difference in handset battery life.
Good
|
Bad
|
|
XDA DISPLAY A- |
Methodology ▼
Brightness


The LG V40 ThinQ display, just like Samsung’s, supports a higher peak brightness in auto brightness, compared to manual, when under high ambient lighting. A fullscreen white image at maximum brightness on the LG V40 ThinQ display was measured to emit 556 nits, which appears only about 7% dimmer than Samsung’s and Apple’s 640 nits on their respective flagship displays.
However, at 50% APL, which is a better representation of most content, the LG V40 ThinQ display performs extraordinarily well, measuring a white level of 781 nits. This measures higher than Apple’s latest handsets and is indistinguishable from Samsung’s peak emission at this APL. At a tiny 1% APL, the LG V40 display peaks out at 914 nits.
At its dimmest, the LG V40 ThinQ can go as low as 2.3 nits, which puts it around the same minimum brightness as most Androids OLEDs. Apple’s latest OLED displays, however, measure down to 1.8 nits, which noticeably appears a tad dimmer (by about 12%).
For the OLED’s dynamic brightness response to on-screen APL, it looks that LG has made an effort to control the white level at different APLs (outside of high brightness mode), measuring a maximum luminance delta of 8% between the highest white level and the lowest white level between 100% and 10% APL, which is excellent. This is required to have consistent display gamma and color accuracy at different brightnesses and APLs. However, we found that LG still has a varying resulting gamma at different APLs even with proficient dynamic brightness control, which is a shame.
Black clipping, informally called “black crush,” is when darker color tones appear identical to the display’s rendering of pure black (the display’s “black level”). We measured our LG V40 display to have a black clipping threshold for drive levels of 2.7% or lower, which is on par with what we have measured for the Galaxy Note 8 and the Galaxy Note 9. The LG display on the Pixel 3 has a black threshold of 6.0%, with the “higher quality” Samsung panel on the Pixel 3 XL having a black threshold of 4.7%, which further supports that the black clipping on their panels, even on the Pixel 2 XL, is due to their panel calibration (on top of other supporting data) and not due to the LG display as some have criticized. LG is doing very well here.
Color Profiles
The LG V40 ThinQ provides an overwhelming seven different color profiles to choose from, defaulting to Auto.
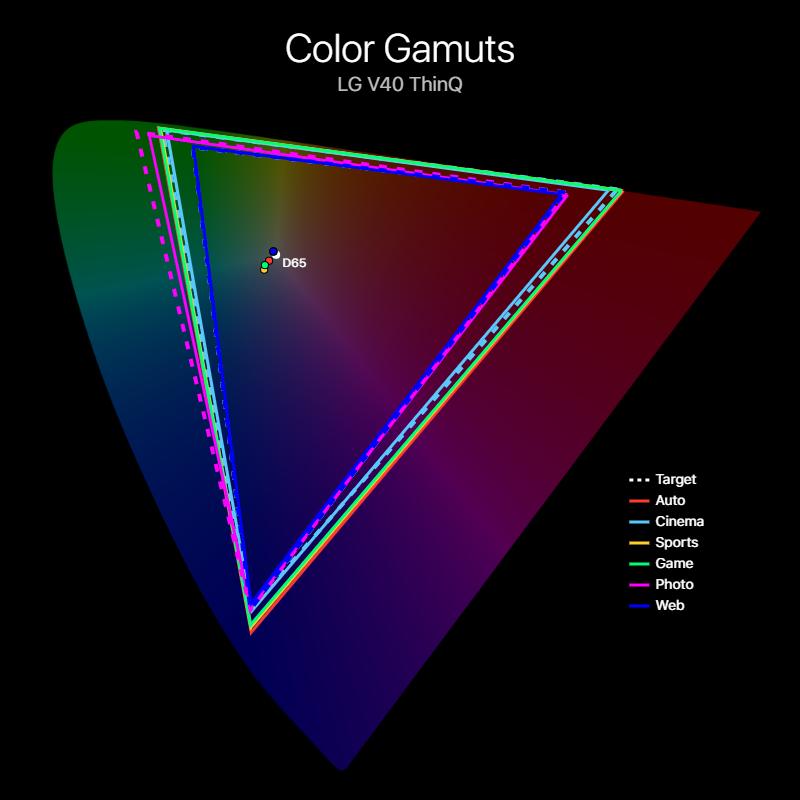
The default Auto color profile is a wide gamut color-stretching profile that most closely matches the P3 color space. It has an intentionally colder white point at 7282K, with deeper blues and slightly deeper greens than the P3’s primaries. LG, in a press release, told us that Auto can “automatically analyze current content, such as video, game, photo or web, and optimize display setting while reducing power consumption,” but I could not get this to happen even on images with embedded ICC profiles. In this profile, linear RGB adjustments are available as well as a slider to modify the color temperature.

LG V40 ThinQ Color Temperature RGB Balance
Unfortunately for LG, whoever was in charge of the color temperature slider failed miserably in doing so, as the “Cooler” values actually decreased the correlated color temperature of the white point, and the “Warmer” values increased it, opposite to intuition. What LG has done is lowered the green drive levels and increased the red drive levels as the slider approached “Warmer,” while barely touching the blue drive levels. All the adjustments make for very similar correlated color temperatures, which is a great example of how similar correlated color temperatures can look very different. This is why a white point with a correlated color temperature close to 6504K is not always considered accurate, which you will soon see is the case for the LG V40 ThinQ display.
The Cinema profile targets the P3 color space, which is the color space commonly targeted by the film industry. Since the profile attempts to target a display gamma of 2.2, it is targeting what is now colloquially being called Display P3, in contrast to DCI-P3, which targets a display gamma of 2.6. It has a white point of 6477K, very close to its D65 target of 6504K.
The Sports profile appears similar to the Auto color profile, except with slightly less-saturated blues and a much colder white point at 8297K. I have no idea what this has to do with sports.
The Game profile is just about identical to the Sports profile, except with a white point that is in-between the Auto and Sports profile at 7877k. This profile also doesn’t make any sense.
The Photo profile seems to attempt to target the Adobe RGB color space, which is usually targeted by color profiles named “Photo” (like on Samsung’s devices). It matches the proper red and blue primaries, which is shared with sRGB, but it seems to undershoot the green primary. It has a white point of 6478K, very close to its D65 target of 6504K.
The Web profile targets the sRGB color space, the standard “default” color space of the world wide web and most content. This will be the color-accurate profile for almost all circumstances, except for when the content is described in other color spaces, which is still few and rare within the Android ecosystem with the notable exception of HDR media on certain platforms such as YouTube and Netflix. It has a white point of 6489K, very close to its D65 target of 6504K.
The Expert profile by default is identical to the Auto profile, with linear RGB adjustment and color temperature sliders. There is also additional sliders available that can modify the Saturation, Hue, and artificial Sharpness of the screen.
Contrast and Gamma


LG is using a transfer function that starts slow (γ < 2.2) up to about 30% drive level, then speeds up (γ > 2.2) before nearly overshooting at 90% drive level, in which it kinks towards 95% then finally fills to 100%. This is not ideal, and an obvious hint at a struggle in calibration, but better than having an overall gamma that is too high or too low. What LG is doing is keeping shadows legible by starting with a low, lighter gamma in the shadows, but it persists through the mid-tones and the transfer function must compensate by speeding up. However, the pace of the transfer function doesn’t seem to align at 100%, so they throw in a “fix” at the higher drive levels. As a result, shadows appear slightly brighter than standard on the LG V40 ThinQ, with darker mid-tones, and highlights may be clipped — some higher drive levels are actually measured to be slightly dimmer than drive levels below it.
Color Temperature
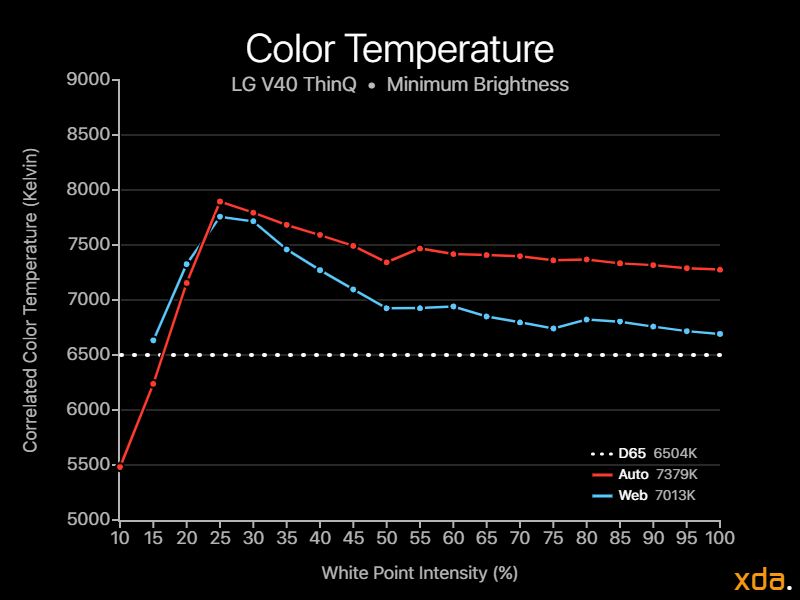

In the LG V40’s wide color-stretching profiles, the white point consistency appears mostly excellent. There does seem to be a sharp shift, however, in cooler temperatures at 10% drive levels and below, which may make dark backgrounds appear a different temperature with increasing severity at lower brightnesses. The same will be true for the calibrated color profiles, which appear more jagged throughout the entire curve with a gradual shift towards cooler temperatures below 50% drive levels.
Color Accuracy
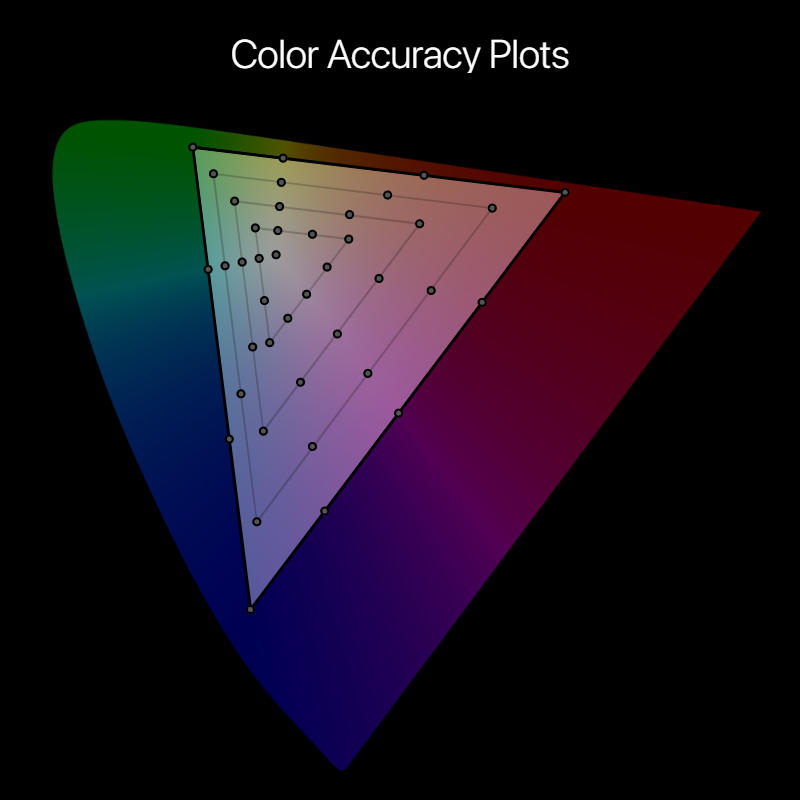
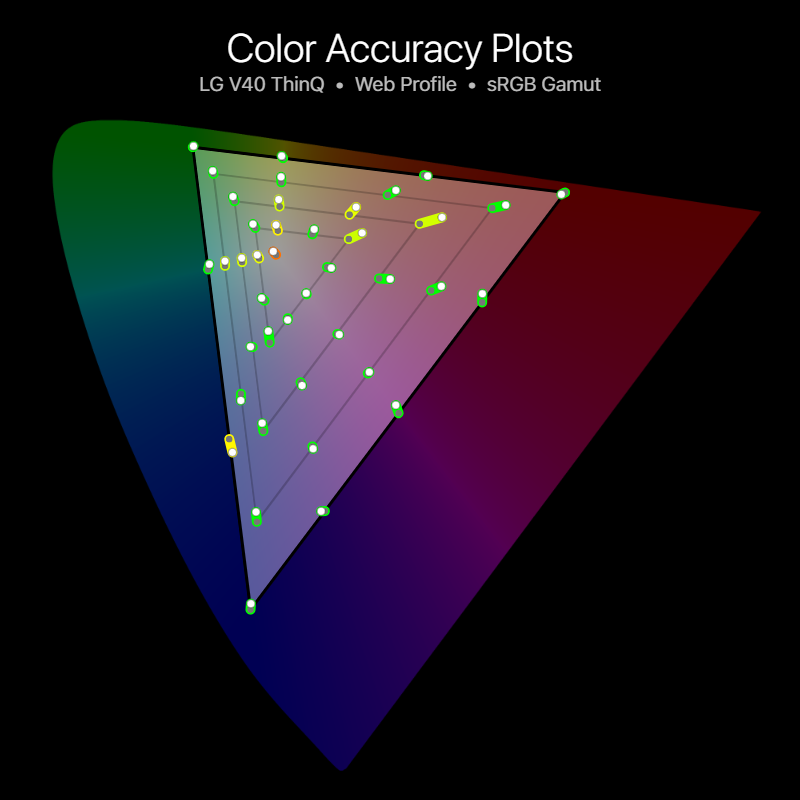
LG V40 ThinQ sRGB Accuracy Plots: Web Profile
Starting at the profile with the most important color space to target, the Web profile does an alright job at reproducing the sRGB color space. However, as shown on the color accuracy plots above, the white point has a noticeable color error shifting towards green, which is also observable on the plot chart in the yellow, cyan, and cyan-blue color mixtures. Pure reds are also slightly oversaturated, but not too-noticeably so. Overall, the profile has an average color error ΔE of 1.7 and a maximum color error ΔE of 3.1 at 100% cyan-blue and 25% yellow, which is mostly accurate and acceptable for hobbyist-level sRGB color work in photos and video.

LG V40 ThinQ P3 Accuracy Plots: Cinema Profile
The Cinema profile, however, is not as accurate and contains a lot more colors with higher color differences. Almost all colors, besides the gamut primaries (100% red/blue/green), are oversaturated, and there’s noticeable error all throughout the reds, red-yellows, yellows, and greens. The white point shared with the Web profile is also too green. The profile has an average color difference that is considered just-noticeable (ΔE = 2.3), with a maximum error ΔE of 4.2 all around the red-yellow-green region. I would like to reiterate that this profile is meant for content that targets the P3 color space, and everyday use of it will result in content colors that will appear oversaturated.

LG V40 ThinQ Adobe RGB Color Accuracy Plots: Photo Profile
The Photo profile is also not too good, beginning with the display’s green emitter not capable of reaching the full chromaticity of the Adobe RGB green primary; however, the 100% green color difference is not noticeable. Below 100% green saturation, however, there is noticeable color error with a high color error ΔE of 5.0 at 25% green. Yellows also show a lot of noticeable errors, a few other just-noticeable color differences are scattered throughout the gamut. The profile has an overall average color error ΔE of 2.1 (which is technically mostly accurate), but the high color errors the profile contains makes it unsuitable for color-critical work in the Adobe RGB color space.
Display Overview
Final Thoughts on the LG V40 ThinQ Display
From the “worst viewing angles” on an OLED with the blue shift on the Pixel 2 XL, the LG V40 ThinQ display has the best viewing angles I have seen on a mobile display, and completely without the jarring red/green striated mini-shifts as seen on many angles on even the best of Samsung’s displays. This is something I already noted that wasn’t present on the Pixel 2 XL and LG V30 display, and I made a strong prediction that, because of how LGD tackles angular shifts, they would surpass Samsung very soon in that department, and they have. There were already a few lucky users (myself included) with Pixel 2 XL units that had very little “blue shift” and were comparable to the next-gen LG V40. In display brightness, the LG V40 ThinQ is comparable to the best of the best in OLED, plain and simple. In color accuracy, LG Mobile is most likely to blame for the calibration, as the color accuracy on the LGD panel on the Pixel 3 is phenomenal.
One of the latest improvements Samsung has made to their OLED DDICs is their dynamic brightness control which allows calibrated display profiles to target a specific display gamma much more accurately, resulting in faithful color tonality and even greater chromatic accuracy. This is done by either limiting the voltage of the display TFTs, regardless of APL/voltage load, to its capacity at 100% APL TFT voltage load, or increasing the applied voltage at higher APLs. Since the peak brightness of Samsung’s displays at 100% APL have not increased, it seems they have applied the former. This was an aspect I did not expect LG Display to implement so soon, but it is evident that they have in the LG V40 by their peak brightness readings at different APLs. Samsung did not implement this until the Galaxy S9, and the Samsung panel and DDIC in the Pixel 3 XL use the same tech. However, this was not evident in the Pixel 3’s LGD-made OLED, so it is not yet known if it is LGD’s proprietary DDIC tech or if they will ship it out with their panel package.
Despite the seemingly high number of “Bads” listed for its display, the LG V40 ThinQ still receives an A- grade since the Bads are very nitpicky and are not a huge detriment to the overall enjoyment of looking at the LG V40’s display. Instead, improvement in some of those last, hard-to-perfect characteristics is what is needed to truly receive an A+ or even an S grade, separating the good from the best of the best — which, for now, are reserved to the iPhone X-series displays.
LG has garnered a lot of animosity throughout the past couple of years, especially in their handsets. Their mobile display division’s initial significant OLED appearance on the LG V30 and the Pixel 2 XL reaped LG an even worse reputation. Month after month the public continued to disregard and condescend their mobile OLED efforts despite the significant investments from Google and Apple, with mockeries like “LG’s displays are at least 5 generations behind,” and that “they will never be able to catch up to Samsung.”
Well, it looks like they already have.
If you’re interested in the LG V40 ThinQ, we recommend you subscribe to the XDA forums for the device. There you’ll find other owners of the device who have shared tips, tricks, guides, mods, and more.
If you want to learn more about the other aspects of the LG V40, you should check out our written review and our video review. The device is available for sale in the United States and most recently, India.
(India) Buy on Amazon.in(U.S.) Buy from Best Buy, B&H
Refference - xdadevelopers.com


0 Comments